Tracking Examples
PortX Transaction Monitor enables you to monitor B2B transaction data traveling through PortX. This section identifies examples in which PortX (PortX) is useful to track B2B exchanges. A basic knowledge of PortX is assumed; see PortX for more information.
Transaction Monitor allows you to track events. An event is defined as the type of data that travels through PortX. Track events under the following tracking categories.
For information on replaying a transaction see Replaying an Incomplete Transaction.
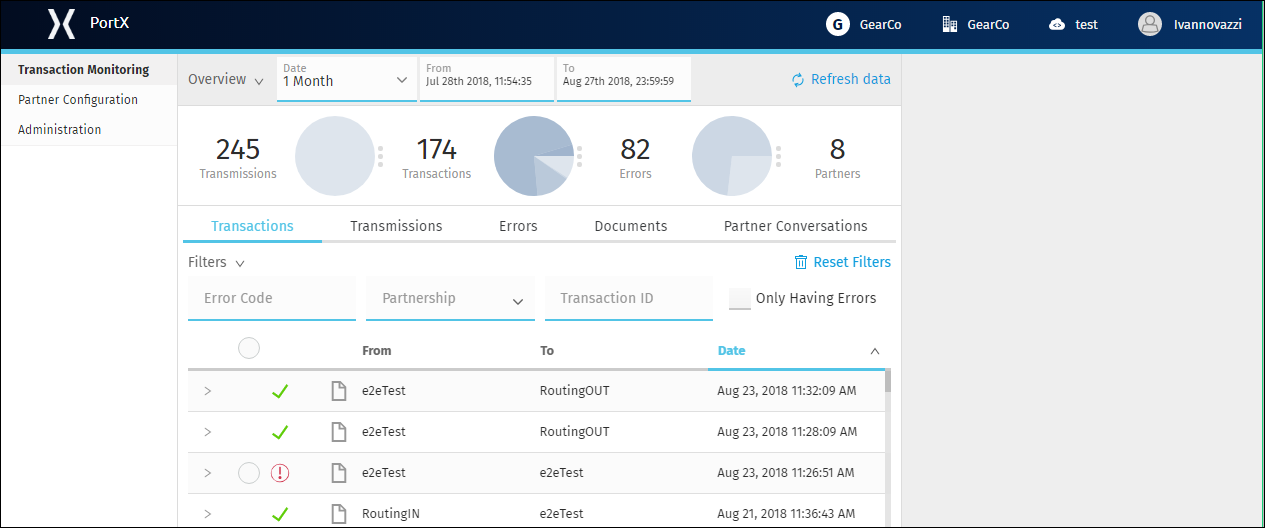
This page identifies components of the Transaction Monitoring Page; see also Central Pane Elements for more information.
Get Started
-
Start PortX. The Transaction Monitoring Page appears.
-
By default, the Transaction Monitoring page presents data for today’s transactions.
To change the time period, see Timeframe Dropdown List.
To change the type of data displayed, see View Dropdown List.
Replaying an Incomplete Transaction
On the Transaction Monitor Page, the Transactions View includes a table in which each row corresponds to a transaction. The first column shows transaction completion status, as follows:
- Green checkmark
-
Indicates a complete transaction.
- Red exclamation point (!)
-
Indicates a transaction has one or more errors that prevented completion.
After you identify and fix the cause of the error that prevented the transaction from completing, you can re-run the transaction.
Possible errors include:
-
Server down
-
Dependency (for example, a map or code element) has changed
-
Required data is absent
| Only replay transactions after resolving the issue or issues that caused the error. |
To Replay a Transaction
-
Click the row corresponding to the transaction you want to replay.
For a transaction to replay, the third (Replay Status) column must be blank or contain a gray partial circle, but must not contain a blue partial circle. A blue Replay button appears in the top Dashboard.
-
Click the blue Replay button.
The button becomes unclickable, and a message that the transaction is being replayed appears in its place.
Once the transaction has been replayed, the blue replay circle appears in the Replay Status Column of the transaction that you replayed.
-
To see if the replayed transaction succeeded or failed, click the replayed transaction.
-
In the Transaction Detail Pane, a link to view replays appears.
This automatically filters the content area by Transaction ID, so that only transactions that are replays of the original transaction appear.
If the replayed transaction fails again, repeat this process until the replay completes.
You can always view a list of all of your transactions that have been replayed from a given original transaction, by clicking the view replays link in the Transaction Detail Pane for any transaction in which the blue replay circle appears in the Replay Status Column.
When viewing a replayed transaction, you can click the view original button in the Detail Pane to return to the first transaction.
Once the replay succeeds, a green check appears next to the replayed transaction.
| You can continue replaying the transaction, with the same replay button, but you will be alerted with a warning before you can continue. This is to prevent unnecessary replays from happening. |
Tracking Transactions
Tracking transactions is a primary function of analyzing B2B communications in PortX. You can use the Transactions View as your starting page to track events in PortX.
See also Transactions View for more information.
Track in the Dashboard
The Dashboard at the top of the Transaction Monitoring Page provides a data summary of events in a given timeframe (the default setting is current day) including how many transactions have been detected during that timeframe.
- Start
-
-
Hover over different slices of the Transactions Pie Chart to see what types of transactions have occurred.
-
To see information for a given transaction type, click one of the slices.
The Transactions View appears, showing only the transaction type you selected.
-
Track in Transactions View
Use Transactions View to quickly filter events and track transactions.
- Viewing Filter
-
Use the Viewing filter to batch transactions by Actor Type. Select one of the following buttons.
-
Both (Default)
-
Partners
-
Applications
-
Track with Transaction ID
Use the Transaction ID tab in the Filter Bar to locate a transaction.
-
Select Transactions in the View Dropdown List
The Transaction View appears.
-
Enter the Transaction ID in Transaction ID tab in the Filter Bar.
Only this transaction appears in the Content Area.
-
Click on the transaction.
The Transaction Detail Pane appears.
Detail Pane
The Transaction Detail Pane includes:
-
Who the transaction is From
-
Who the transaction is To
-
Date of the Transaction
-
The Transaction ID
- View Preceding or Next Transaction
-
If the Transaction is part of a stream of Transactions from one Actor Relationship, you can click the following links.
-
Click View Preceding Transaction in the Detail Pane.
Only the current and preceding transaction appear in the Content Area.
-
Click View Next Transaction in the Detail Pane.
Only the current and next transaction appear in the Content Area.
-
- View Original
-
If the Transaction is a replay:
-
Click View Original in the Detail Pane.
Only the original and the replayed transaction appear in the Content Area.
-
- View Replays
-
If the transaction is replayed:
-
Click View Replays in the Detail Pane.
Only the replayed transactions, and the original appear in the content area.
-
Track by Relationship (Your Company B2B)
Use the Relationship filter to track transactions between Actors (partners or applications). This filter is useful in that it allows you to track multiple transactions that occur between Your Company and specific Actors.
- Start
-
-
Select Transactions in the View Dropdown List.
The Transactions View appears.
-
In the Timeframe Dropdown List, choose an appropriate timeframe that includes the time of the transaction event.
Only transactions of that timeframe appear in the Content Area.
-
Click the Relationship tab in the Filter Bar.
The Relationship Dropdown List appears.
-
In the Relationship Dropdown List select Your Company and the Actor of your choice.
Only transactions of this relationship appear in the Content Area.
-
You can view transactions of other actor relationships by setting different values in the Relationship Filter.
-
-
- Relationship Filter Settings
-
-
Application ←→ Partner
-
Partner ←→ Partner
-
Application ←→ Application
-
Your Company ←→ Application
-
Your Company ←→ Partner
-
| You can always use the Reset Filters button to get back to the full view. |
Tracking Transmissions
Transaction Monitor allows you to track transmissions as they travel from end to end through PortX. Start by tracking individual transmissions in Transactions View, and continue by tracking multiple transmissions in Transmissions View.
See also Transmissions View for more information.
Track in the Dashboard
The Dashboard at the top of the Transaction Monitoring Page provides a data summary of events in a given timeframe (the default setting is current day) including how many transmissions have been detected during that timeframe.
- Start
-
-
Hover over different slices of the Transmissions Pie Chart to see what types of transmissions have occurred.
-
To see information for a given transmission type, click one of the slices.
The Transmissions View appears, showing only the transmission type you selected in the Content Area.
-
Track in Transactions View
Tracking a transmission in Transactions View is a useful way to quickly find detailed information on a transmission, such as:
-
Who it is From
-
The Transmission Type
-
The Message Payload
-
The Status
-
The Transmission ID
-
The Partnership ID
- Start
-
-
Select Transactions in the View Dropdown List.
The Transactions View appears.
-
In the Timeframe Dropdown List, choose an appropriate timeframe that includes the time of the transmission event(s).
Only transactions of that timeframe appear in the Content Area.
-
Click on the transaction containing the transmission.
The Transaction Event Rows appear.
-
Click on the Transmission Event from the Transaction Event Rows.
The Transmission Detail Pane appears.
-
Detail Pane
Use information in the Transmission Detail Pane to facilitate and manage the transmission.
- Complete Message Payload
-
-
Click the blue arrow next to Message Payload in the Detail Pane.
The complete Message Payload appears with the following options:
-
Download
-
Copy Content
-
Copy Payload URl
-
Minimize
-
Close
-
-
- Transmission ID
-
-
In the Detail Pane, click the blue copy icon next to Transmission ID.
-
Copy the Transmission ID to quickly access the transmission in Transmissions View.
-
| You can always use the Reset Filters button to get back to the full view. |
Track in Transmissions View
Tracking in Transmissions View allows you to apply various filters such as:
-
Relationship
-
File Name
-
Transport
-
Transmission ID
Use these filters to compare transmissions and track specific transmissions in PortX.
- Viewing Filter
-
Use the Viewing filter to batch transmissions by Actor Type. Select one of the following buttons.
-
Both (Default)
-
Partners
-
Applications
-
Track by Relationship (Your Company B2B)
Use the Relationship filter to track transmissions between Actors (partners or applications). This filter is useful in that it allows you to view multiple transmissions that occur between Your Company and a specific Actor.
- Start
-
-
Select Transmissions in the View Dropdown List.
The Transmissions View appears.
-
In the Timeframe Dropdown List, choose an appropriate timeframe that includes the time of the transmission event(s).
Only transmissions of that timeframe appear in the Content Area.
-
Click the Relationship tab in the Filter Bar.
The Relationship Dropdown List appears.
-
In the Relationship Dropdown List select Your Company and the Actor.
Only transmissions of this relationship appear in the Content Area.
-
| You can view transmissions of other actor relationships by setting different values in the Relationship Filter. |
- Relationship Filter Settings
-
-
Application ←→ Partner
-
Partner ←→ Partner
-
Application ←→ Application
-
Your Company ←→ Application
-
Your Company ←→ Partner
-
-
Click the Transaction button in the Transmission Detail Pane at the top right to view the transaction with which a transmission is associated.
Track by Transport
Apply additional filters such as the Transport Filter to further track transmissions.
- Start
-
-
Select Transmissions in the View Dropdown List.
The Transmissions View appears.
-
Click on the Transport tab in the Filter Bar.
The Transport Dropdown List Appears.
-
Select a Transport from the Transport Dropdown List.
Only transmissions of that transport type appear in the Content Area.
-
Track by Transmission ID
Use the Transmission ID Filter to quickly track a transmission.
-
Select Transmissions in the View Dropdown List.
The Transmissions View appears.
-
In the Transmission ID filter, enter the Transmission ID.
Only the transmission you enter appears in the Content Area.
Detail Pane
-
In Transmissions View, click on the transmission.
The Transmission Detail Pane appears.
- Copy Long Strings of Data
-
-
Click the blue copy icon to the right of the string.
-
-
Click the Transaction button in the Transmission Detail Pane at the top right to view the transaction with which this transmission is associated.
| You can always use the Reset Filters button to get back to the full view. |
Tracking Errors
If you encounter errors in Transaction Monitor, you can review, assess, and replay these errors by tracking them in PortX. Start by tracking individual errors in Transactions View, and continue by tracking multiple errors in Errors View.
See Errors View for more information.
To replay a transaction, see Replaying an Incomplete Transaction.
Track in the Dashboard
The Dashboard at the top of the Transaction Monitoring Page provides a data summary of what has happened in a given timeframe (the default is the current day) including how many errors have been detected during that timeframe.
-
Hover over different slices of the Errors Pie Chart to see what types of errors have occurred.
-
To see information for a given error type, click one of the slices.
The Errors View appears, showing only the error type you selected.
This enables you to look for a pattern among these errors that help facilitate a solution. This is useful when transactions are failing. but you can’t ascertain the solution by just looking at the transactions themselves.
Track in Transaction View
Follow these steps to track errors in Transactions View.
- Start
-
-
Select Transactions in the View Dropdown List.
The Transactions View appears.
-
In the Timeframe Dropdown List, choose an appropriate timeframe that includes the time of the error event(s).
Only transactions of that timeframe appear in the Content Area.
-
Check the Only Having Errors checkbox in the Filter Bar.
Only errors appear in the Content Area.
-
Locate the error in the Content Area, or Track by Relationship.
-
Click on the error.
The Transaction Event Rows appear.
-
Click on the error event from the Transaction Event Rows.
The Error Detail Pane appears.
-
Click the blue copy icon next to Source ID.
-
Paste the Source ID in the Transaction ID Tab in the Filter Bar.
Only this Transaction appears in the Content Area.
-
See Replaying an Incomplete Transaction for instructions to replay a transaction.
Detail Pane
Use information in the Detail Pane to facilitate a solution to the error.
- Error Message
-
-
Select the error from the transaction the Content Area.
The Error Detail Pane appears.
-
Click the blue file code icon next to the Error Message.
An error message appears.
-
Use values in the Error Message to facilitate a solution to the error.
-
-
To return to the transaction associated with the error, click the Transaction button in the detail pane.
See Replaying an Incomplete Transaction for instructions to replay a transaction.
Track by Relationship
- Start
-
-
Select Transactions in the View Dropdown List.
The Transactions View appears.
-
Click on the transaction that failed to play in the Content Area.
-
Note the From and To variables in the Transaction.
-
Select Errors in the View Dropdown List.
The Errors View appears.
-
Click the Relationship tab in the Filter Bar.
The Relationship Filter Dropdown list appears.
-
Enter the From and To variables of the transaction in the dropdown list.
Only errors of this relationship appear in the Content Area.
-
See Replaying an Incomplete Transaction for instructions to replay a transaction.
Track by Error ID
-
Select Transactions in the View Dropdown List.
The Transactions View appears.
-
Click on the transaction that contains the error.
The Transaction Event Rows appear.
-
Click on the Error Event in the Transaction Event Rows.
The Error Detail Pane appears.
-
In the Detail Pane, click the blue copy icon next to the Error ID.
-
Select Errors in the View Dropdown List.
The Errors View appears.
-
Paste the Error ID in the Error ID tab on the Filter Bar.
Only this error appears in the Content Area below.
-
Save Error ID’s while reviewing transactions, and use them to track specific errors in the Errors View.
-
| You can always use the Reset Filters button to get back to the full view. |
Track in Errors View
Use the Errors View to track and compare multiple errors. It may be useful to first collect information from the Error Detail Pane by tracking in Transactions View, to assist with tracking errors in Errors View.
- Viewing Filter
-
Use the Viewing Filter to batch all errors in the Content Area by partner or application, select one of the following buttons in the Filter Bar.
-
Both (Default)
-
Partners
-
Applications
-
Track by Error Code
Use the Error Code to determine where multiple errors of a specific error type are occurring.
- Start
-
-
Select Errors in the View Dropdown List.
The Errors View appears.
-
Enter the error code in the Error Code tab.
Only errors of that code type appear in the Content Area.
-
Track by Error Source
Use the Error Source filter to track errors from the following source types:
-
Transaction
-
Transmission
-
Document
- Start
-
-
Select Errors in the View Dropdown List.
The Errors View appears.
-
Click the Error Source tab in the Filter Bar.
The Error Source Dropdown List appears.
-
Click on the Error Source.
Only errors of this source type appear in the Content Area.
-
Track by Relationship (Your Company B2B)
Use the Relationship filter to track errors between Actors (partners or applications). This filter is useful in that it allows you to track multiple errors that may occur between Your Company and a specific Actor.
-
Select Errors in the View Dropdown List.
The Errors View appears.
-
Click the Relationship tab in the Filter Bar.
The Relationship Dropdown List appears.
-
In the dropdown list select Your Company and the Actor.
Only errors of this relationship appear in the Content Area below.
-
You can view errors associated with other actor relationships by setting new values in the Relationship Filter.
-
- Relationship Filter Settings
-
-
Application → Partner
-
Partner → Partner
-
Application → Application
-
Your Company → Application
-
Your Company → Partner
-
You can then apply additional filters to Track by Error Source and Track by Error Code to further review and track errors.
| You can always use the Reset Filters button to get back to the full view. |
Tracking Documents
In Transacion Monitor you can track Documents as they travel through PortX from end to end as a complete document flow. Start by tracking individual documents from Transactions view, and continue by tracking multiple documents in Documents View.
See also Documents View for more information.
Track in Transactions View
Tracking a document in Transactions View is a useful way to quickly find detailed information on a document, such as:
-
Document ID
-
Standard Used
-
Document Version
-
Message Type
-
Date received
-
Is it a Duplicate?
-
Message Payload
-
Partnership ID
Track by Relationship (Your Company B2B)
Use the Relationship Filter to track documents from an Actor (partner or application) to Your Company.
- Start
-
-
Select Transactions in the View Dropdown List.
The Transactions View appears.
-
In the Timeframe Dropdown List, choose an appropriate timeframe that includes the time of the document event(s).
Only transactions of that timeframe appear in the Content Area.
-
Click on Relationship in the Filter Bar.
The Relationship dropdown list appears.
-
In the Relationship Dropdown List, select Your Company and the Actor.
Only transactions of this relationship appear in the Content Area.
-
Click on the Transaction.
The Transaction Event Rows appear.
-
Click on the Document Event from the Transaction Event Rows.
The Document Detail Pane appears.
-
-
You can view documents of other actor relationships by setting different values in the Relationship Filter.
- Relationship Filter Settings
-
-
Application ←→ Partner
-
Partner ←→ Partner
-
Application ←→ Application
-
Your Company ←→ Application
-
Your Company ←→ Partner
-
Track in Documents View
In some cases, a partner requests information on a document. Follow these steps to use the Documents View to track document information.
- Viewing Filter
-
Use the Viewing filter to batch documents by Actor Type. Select one of the following buttons.
-
Both (Default)
-
Partners
-
Applications
-
- Start
-
-
Select Documents from the View Dropdown List.
The Documents View appears.
-
In the Timeframe Dropdown List, choose an appropriate timeframe that includes the time of the document event(s).
-
In the Document ID filter, enter the Document ID that the partner provided you.
Only that document appears in the Content Area.
-
Click on the document.
The Document Detail Pane populates with information relevant to the partner’s request.
-
- Copy a Long String
-
To assist your partner, copy a long string of information from the Detail Pane for their use.
-
Click the blue copy icon to the right of the string.
-
Save the copy in a document for your partner.
-
- Search Properties
-
In the Detail Pane you can search for properties.
-
Populate the Properties search bar with a property.
The Detail Pane filters by property.
-
Click the blue copy icon to the right of a string, to copy document properties.
-
-
Click the Transaction button in the Detail Pane, to return to the original transaction in Transactions View.
Track by Property Name and Property Value
- Start
-
-
Select Documents in the View Dropdown List.
The Documents View appears.
-
In the Timeframe Dropdown List, choose an appropriate timeframe that includes the time of the document event(s).
-
Click on Property Name in the Filter Bar.
The Property Name Dropdown List appears.
-
Click on the Property Name you are tracking with.
-
Example: Interchange Control Number (system)
Documents with that property appear in the Content Area.
-
-
Enter a Property Value that is valid to the Property Name, in the Property Value tab on the Filter Bar.
-
Example: Number (Nine Digits)
-
-
Only Documents with that Property Name and Property Value appear in the Content Area.
-
Track by Document Standard
- Start
-
-
Select Documents in the View Dropdown List.
The Documents View appears.
-
In the Timeframe Dropdown List, choose an appropriate timeframe that includes the time of the document event(s).
-
Click on Standard in the Filter Bar.
The Standard Dropdown List appears.
-
Click on the Standard.
-
Example: X12
Only documents with that standard appear in the Content Area.
-
-
Apply other filters such as: Property Name, Property Value, and Relationship to further track documents in the Documents View.
| You can always use the Reset Filters button to get back to the full view. |